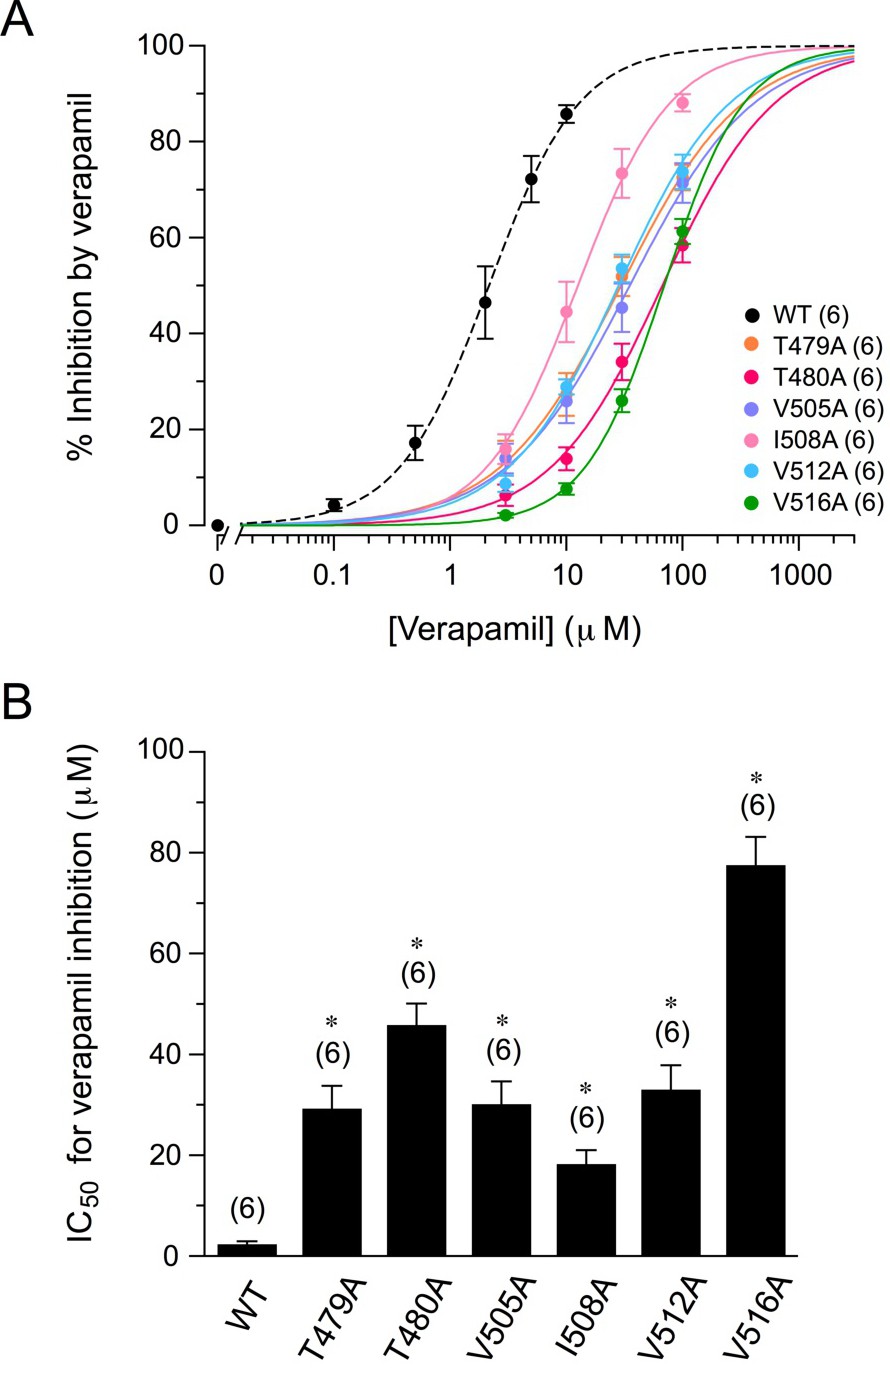
Fig. 5. Changes in IC50 for verapamil block caused by mutant hKv1.5 channels. (A) Concentration-response relationships for the blocking effect of verapamil on wild-type (WT) or mutant (T479A, T480A, V505A, I508A, V512A and V516A) channels. Smooth curves through the data points represent a least-squares fit of Hill equation, yielding IC50 values. (B) IC50 for verapamil blockade of wild-type (WT) and mutant (T479A, T480A, V505A, I508A, V512A and V516A) channels. The number of experiments is indicated in parentheses. *, P<0.05 compared with wild-type channel.